The Impact of Volatility on CFD Trading
Last Updated: May 14, 2026
The impact of volatility on CFD trading is not primarily about price direction—it is about how leverage multiplies risk during rapid market movement. Traders who survive volatile markets adjust exposure, margin, and strategy before the spike, not after it.
Most traders misunderstand volatility. They think the danger is price moving fast. It is not. The real danger is holding oversized leveraged positions when price movement expands beyond normal ranges.
Volatility increases the size and speed of price fluctuations. In CFD trading, those fluctuations are amplified by leverage, which directly increases drawdowns, margin pressure, and liquidation risk. If you do not reduce exposure as volatility rises, your account becomes structurally fragile.
1. What Volatility Really Means in CFD Trading
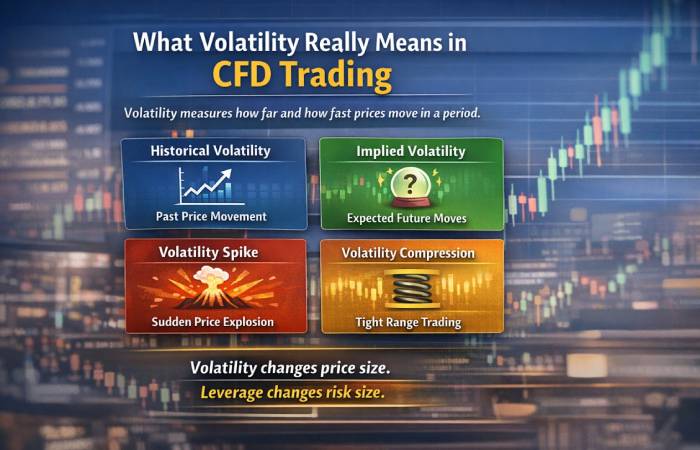
Volatility measures how far and how fast prices move within a given period. In traditional investing, volatility mainly affects portfolio fluctuation. In CFD trading, it directly affects account survival because positions are leveraged.
Volatility matters more than direction because it determines how quickly margin is consumed.
Core Volatility Concepts
| Concept | Simple Definition | Why It Matters in CFDs |
| Historical Volatility | Past price movement range | Helps estimate “normal” movement |
| Implied Volatility | Expected future movement | Often rises before news |
| Volatility Spike | Sudden explosive movement | Raises liquidation risk |
| Volatility Compression | Narrow range trading | Often precedes breakout |
| Volatility Clustering | High volatility tends to persist | Risk remains elevated |
Institutions monitor volatility indicators like the VIX for equity markets. But retail CFD traders rarely adjust leverage based on volatility conditions. That mismatch creates structural weakness.
2. Why CFDs Amplify Volatility
CFDs allow traders to control larger positions using borrowed exposure. That borrowed exposure magnifies both gains and losses.
Volatility alone does not destroy accounts. Volatility combined with leverage does.
Leverage vs Price Movement Impact
| Price Move | 1x | 5x | 10x | 20x |
| 1% | 1% | 5% | 10% | 20% |
| 3% | 3% | 15% | 30% | 60% |
| 5% | 5% | 25% | 50% | 100% |
| 10% | 10% | 50% | 100% | 200% |
Illustrative Example
- Account: $5,000
- Leverage: 10x
- Exposure: $50,000
- Market moves -5%
Loss: $2,500 (50% drawdown)
If volatility continues another 5%, account equity approaches liquidation threshold.
The movement itself is not extreme. The leverage is.
3. The Volatility–Leverage–Margin Triangle
Think of CFD risk as a triangle:
- Price Range
- Leverage
- Margin Requirement
If price range expands while leverage remains high, margin is consumed faster.
Structural Interaction Model
| Volatility | Leverage | Margin Stability | Risk Outcome |
| Low | Moderate | Stable | Manageable |
| Rising | High | Compressed | Elevated |
| High | High | Fragile | Liquidation risk |
| High | Reduced | Balanced | Controlled |
Margin is the final line of defense. When margin drops below broker maintenance requirements, positions close automatically.
4. Broker Adjustments During Volatility
Brokers are not passive. They actively manage systemic risk.
During volatility spikes, they may:
- Increase required margin.
- Reduce maximum leverage.
- Widen spreads.
- Trigger forced liquidation earlier.
Volatility vs Broker Reaction
| Market Condition | Broker Adjustment | Trader Impact |
| Calm market | Standard leverage | Predictable margin |
| Moderate spike | Margin increase | Less flexibility |
| High volatility | Leverage reduced | Increased liquidation probability |
| Extreme event | Emergency close-outs | Capital protection measure |
Regulators such as the FCA (UK), ESMA (EU), and ASIC (Australia) cap retail leverage for this reason. Offshore brokers offering higher leverage increase opportunity—but also structural fragility.
5. Volatility Regimes & Strategy Alignment
Volatility is cyclical, not random.
Four Common Regimes
| Regime | Characteristics | Opportunity | Risk |
| Compression | Narrow range | Low | Sudden breakout |
| Expansion | Breakout phase | High | False break risk |
| Sustained High | Strong trend | High | Sharp pullbacks |
| Exhaustion Spike | Climactic move | Short-term reversal | Extreme slippage |
Strategy Matching Table
| Regime | Best Strategy | Avoid |
| Compression | Range trading | Breakout chasing |
| Expansion | Breakout entries | Tight stops |
| Sustained High | Trend-following | Counter-trend |
| Exhaustion | Reduce exposure | Full leverage entries |
Most beginners enter during exhaustion spikes—when volatility is already extreme.
6. Asset Class Volatility Differences
Not all markets behave the same.
Comparative Volatility Profile
| Asset Class | Primary Driver | Gap Risk | Liquidity | Volatility Pattern |
| Forex | Economic data | Low–Moderate | High | Event-driven spikes |
| Stocks | Earnings/news | High | Moderate | Gap-prone |
| Indices | Systemic sentiment | Moderate | High | Correlated swings |
| Commodities | Supply/geopolitics | High | Variable | Shock-driven |
For example:
- Forex spikes during interest rate decisions.
- Stocks gap during earnings.
- Oil surges during geopolitical conflict.
- Indices collapse during systemic crises.
Each requires different leverage discipline.
7. Stop-Loss Reality in Volatile Markets
Stop-losses are necessary but not perfect.
During high volatility:
- Slippage occurs.
- Execution may skip levels.
- Spreads widen dramatically.
Stop Order Comparison
| Type | Protection | Cost | Limitation |
| Standard Stop | Market exit | None | Slippage risk |
| Guaranteed Stop | Fixed price | Premium | Limited instruments |
A stop-loss reduces risk but does not eliminate structural exposure from oversized positions.
8. Psychological Risk Multiplier
Volatility increases emotional intensity.
Common mistakes:
- Increasing size after quick gains.
- Revenge trading after losses.
- Removing stop-loss in panic.
- Overtrading during spikes.
Behavior Pattern vs Outcome
| Behavior | Short-Term Effect | Long-Term Result |
| Increase leverage during spike | Rapid gains possible | High liquidation risk |
| Reduce size during spike | Smaller wins | Long-term survival |
| Emotional exits | Inconsistent returns | Equity erosion |
| Structured discipline | Controlled risk | Sustainable growth |
Professionals reduce exposure when volatility expands. Beginners often do the opposite.
9. Practical Risk Control Framework
CFD trading requires volatility-adjusted position sizing.
Risk Per Trade Model
| Account Size | 1% Risk | 2% Risk |
| $1,000 | $10 | $20 |
| $5,000 | $50 | $100 |
| $10,000 | $100 | $200 |
| $25,000 | $250 | $500 |
Volatility Adjustment Rule
| Volatility Condition | Suggested Adjustment |
| Normal | Standard position |
| Elevated | Reduce size 25–30% |
| High | Reduce size 40–50% |
| Extreme | Minimal exposure |
Pre-Trade Volatility Checklist
| Question | Yes/No |
| Has ATR expanded significantly? | |
| Is major news approaching? | |
| Has broker margin changed? | |
| Is spread wider than average? | |
| Is position size reduced? |
If multiple answers indicate elevated risk, shrink exposure.
10. Is High Volatility Good or Bad?
Volatility is opportunity density. But opportunity density without discipline equals accelerated loss probability. High volatility rewards preparation. It punishes overconfidence.
Outcome Comparison
| Trader Type | Reaction to Volatility | Likely Result |
| Over-leveraged | Keeps size constant | Margin call risk |
| Disciplined | Reduces leverage | Controlled growth |
| Emotional | Overtrades spikes | Inconsistent returns |
| Structured | Trades regime | Sustainable edge |
Final Verdict: Volatility Is a Multiplier
Volatility is not inherently good or bad—it is a multiplier. It magnifies whatever risk structure you bring into the market. If you are over-leveraged, it accelerates losses. If you are disciplined, properly sized, and margin-aware, it expands opportunity. In CFD trading, price movement is only the surface layer; leverage and margin determine survival. The traders who endure volatile markets are not those who predict direction perfectly, but those who reduce exposure before conditions intensify. Control leverage, respect margin, and volatility shifts from being a threat to becoming a calculated advantage.
Also Read: Best Restaurants Near Me In Suryapet